avator

{{userAccount}}

Welcome to BenQ Academy

Set up your profile in a few simple steps and start learning at your own pace.

Which of the following best describes your role?

  • Teacher

    Teacher

  • IT

    IT

  • Trainer

    Trainer

  • Other

    Other

This field is required.

Select the topics you're interested in to personalize your learning experience.

  • {{tag.tagName}}

Back

You're all set!

You can edit your preferences at any time in Account > Content Preferences or by clicking the icon at the top right corner of the page.

Playlists {{videoSectionHeight}}

ON

OFF

Autoplay
  1. {{video.aemTitle || video.youtubeTitle}}

[DMS] How to use the new dashboard
Device management DMS IT Trainer

The new DMS has a dashboard that has all the analytics you need to optimize the use of your BenQ Boards and smart signage.

Learn the step-by-step guide and get an overview of how the BenQ DMS Dashboard helps you experience enhanced ease and efficiency in BenQ Board and smart signage management.

Step-by-Step Guide and DMS Dashboard Overview

1. Go to dms.benq.com → Log in with your admin credentials.

2. You can access the dashboard, which gives you all the most recent BenQ smart display updates and analytics at a glance.

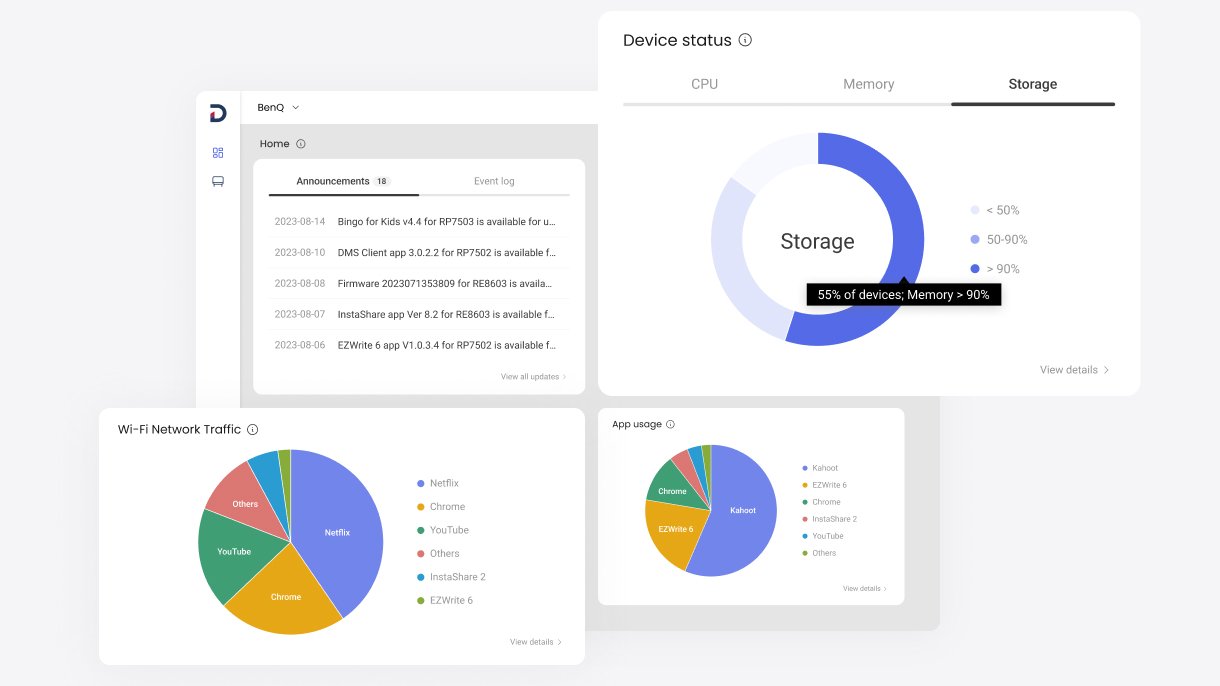
  • Announcements: Lets you know every time there’s a new update available for your BenQ Board and smart signage firmware or its apps such as EZWrite or InstaShare. Clicking the Event log tab shows you the log of all the latest firmware and app updates, system errors, and the status of your scheduled management tasks.

The rest of the dashboard gives you a comprehensive overview of the performance and usage of your BenQ smart displays.

  • Device Status: Gives you details on your smart display’s CPU performance, memory consumption, and available storage space.
  • App Usage: Provides insight into which apps teachers use the most and which processes consume the most internet bandwidth.
  • Power Consumption: Shows an estimate of how much energy your displays are using.
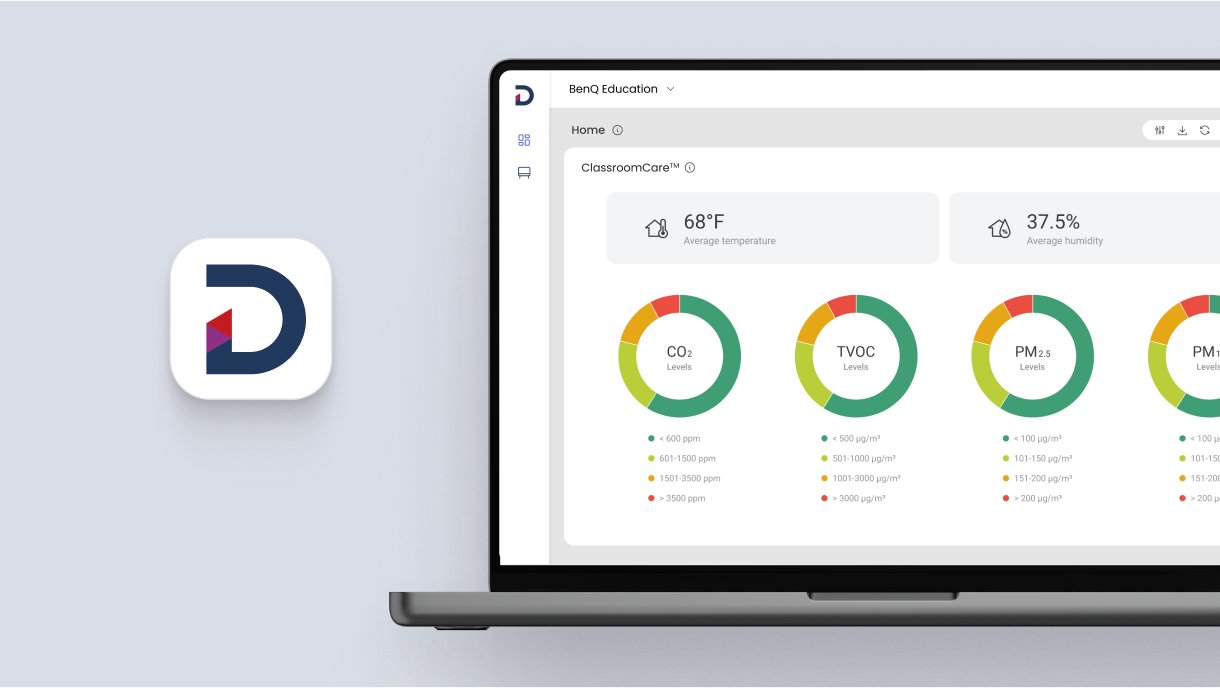
  • ClassroomCare: Provides an overview of all health-related data in your classrooms from CO2 and PM2.5 levels to the average indoor temperature and humidity. This data can help you gauge if your current HVAC settings are adequate.

BenQ DMS Dashboard shows the detailed ClassroomCare summary over time.

If you want to know the detailed analytics of a particular display, go to the main menu on the left → Click Devices → Select a display, then click the Detailed info icon → click the Device Analytics tab to get a full detailed analysis.

Mark as complete

Was this helpful? Yes No
Thanks for your feedback.